Turning Taiwan's flood potential maps into something clickable: the data, the numbers, and what must not be said
The fifth tool is live: flood potential lookup. This is what I measured and computed while building it, including several numbers that would read as conclusions on the page but are only simulation output.
2026-08-21 作者 William Hsu
Where the data comes from and what it looks like
Taiwan's Water Resources Agency publishes "flood potential maps" on the government open data platform (dataset 25766, under the government open data licence). There are two sets: a 2018 per-county pack of 7z files, and a 2022-08 nationwide set organised by the agency's spatial information service, split by rainfall scenario. I first pulled the Keelung county pack: of its 87 MB, 150 MB unpacked is ten poster JPGs at 14,044×9,934 pixels, and the shapefiles you can actually compute with are only a few MB. So I switched to the national set: ten scenarios, 140 MB in total, no JPGs, and every polygon carries a township code.
- Scenarios 150/250/350 mm over 6 hours, 200/300/400 mm over 12 hours, 200/350/500/650 mm over 24 hours — ten in all
- Depth bands 0.3–0.5, 0.5–1, 1–2, 2–3 and over 3 metres. Below 0.3 m is not drawn
- Coordinates TWD97 two-degree zone; 1,204 to 2,356 polygons per scenario, the largest file 3.75 million vertices
- Version third generation, built 2022-08-12; the agency reviews it every five years
Township boundaries come separately from the Ministry of the Interior's National Land Surveying centre (March 2025 edition, 368 townships), used as the area denominator and to decide which township a clicked point falls in.
Making it clickable
The source is vector polygons, and the obvious approach is vector tiles. I do not have tippecanoe, and the lookup people actually want is "what band is this point in, in each of the ten scenarios", which with polygons means ten point-in-polygon tests. So I went with a grid instead:
- Rasterise each scenario onto an equirectangular grid of 0.0004° longitude by 0.00036° latitude — about 41×40 metres in Taiwan, the same order as the source's 40-metre grid. Finer would be false precision.
- Each cell stores the band for all ten scenarios, 10 bytes per cell, and only cells that flood in at least one scenario are stored: 1,276,400 cells, 28 MB of SQLite.
- Coarser 8×8 and 64×64 merged grids are stored too, taking the maximum band, for zoomed-out views.
- Tiles are drawn by the server on demand: query the cells in a range, paint a 256×256 PNG, 3 to 30 milliseconds each, then cache. Latitude is Mercator while the grid is equirectangular, so every pixel row has to be converted separately; linear sampling would be wrong.
- The whole rasterisation runs in rasterio: ten scenarios in 82 seconds.
The price of rasterising is that areas drift slightly from the original polygons. Comparing the ten scenarios' polygon areas (computed directly in the TWD97 plane) against the summed cells: the cells always come out 0.3 to 0.5% higher, at most 0.53%, because a cell touching the boundary is counted whole. Acceptable at national level; the smaller the township, the larger that relative error, and the page says so.
Numbers that only appear once you compute them
All of the following are statistics of a simulation, not records of what happened.
How much of Taiwan floods
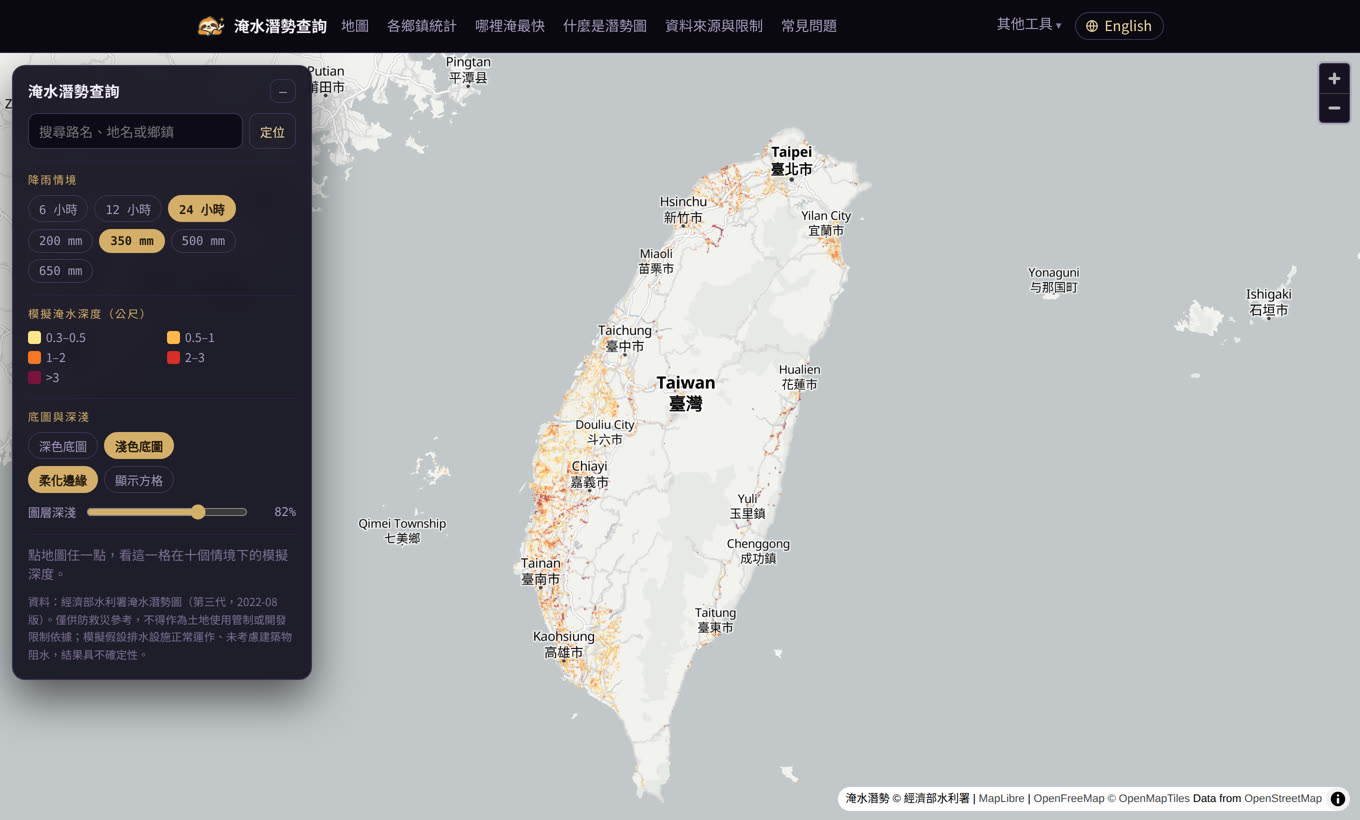
Under 24-hour 350 mm (roughly a typhoon or a strong plum-rain front in a day), the simulated area flooding deeper than 0.3 m is 674.5 km², or 1.8% of Taiwan's land. At 650 mm it becomes 2,060 km², 5.6%. Six-hour 350 mm gives 1,178 km². The same 350 mm squeezed into 6 hours floods 1.75 times the area of the 24-hour case — which is exactly why urban drainage fears short cloudbursts.
Townships with the highest share
In the 24-hour 350 mm scenario the highest simulated flooded shares are Lingya (38%), Qianjin (32%) and Xinxing (30%) in Kaohsiung — but all three are tiny (2 to 8 km²), which inflates the ratio. Large and high at once are Zhuangwei in Yilan (29% of 39.6 km²), Wujie (24%), Dongshi in Chiayi (21% of 82 km²), Liujiao, Yuanchang in Yunlin and Budai in Chiayi.
At 650 mm, Wujie reaches 67%, Zhuangwei 65% and Yilan City 58%. Nationwide, 58 townships pass a quarter of their area and 8 pass half.
Where flooding grows fastest as rainfall rises
Comparing 24-hour 200 mm with 650 mm, the biggest jumps are Wujie 7% → 67%, Yilan City 2.5% → 58%, Zhuangwei 10% → 65%, Qieding in Kaohsiung 5% → 57%, Liujiao in Chiayi 4% → 53%, Hunei in Kaohsiung 1% → 49% and Hsinchu City North District 0.6% → 48%. These places look fine in ordinary heavy rain and go under once the total climbs. Three townships of the Lanyang plain appear together: the terrain is one large bowl.
Townships where a short cloudburst is worse
In 166 townships, the simulated flooded area under 6-hour 350 mm is more than 1.5 times that of 24-hour 350 mm. The widest gaps are Yuli in Hualien (32.5 km² against 5.6 km²), Wufeng in Taichung (16.9 against 1.1), Xingang and Minxiong in Chiayi, Zhubei in Hsinchu and Houbi in Tainan. Most are places whose drainage relies on gravity and simply cannot keep up when it arrives all at once.
Counties
Ranked by share under 24-hour 350 mm: Yunlin 7.9%, Chiayi County 5.1%, Tainan 4.8% and Changhua 3.7% lead. Among the six special municipalities: Tainan 4.8%, Kaohsiung 2.1%, Taoyuan 2.0%, Taichung 0.8%, New Taipei 0.5%, Taipei 0.4%. But Taipei jumps to 6.6% in the 650 mm scenario — at high rainfall the basin's drainage limit shows.
32 townships have not a single flooded cell even in the largest scenario, all of them mountainous (Wutai and Sandimen in Pingtung; Liugui, Jiaxian and Maolin in Kaohsiung; Xinyi and Lugu in Nantou, and so on). That does not make them safe: these maps simulate inundation, and the mountain hazard is debris flow, which is a different map.
What must not be said
The slowest part of building this tool was deciding what the page is allowed to say. The code was the easy half.
- Article 8 of Taiwan's regulations on releasing flood potential data states that the data is for disaster prevention and relief only, and that any land-use control or restriction must follow the rules of the competent authority. So the pages carry nothing about property prices, insurance, or whether to buy.
- Article 4 requires a note that the maps are drawn from design rainfall conditions, specific terrain data and hydraulic model computation, and should be treated with particular care. Written as required.
- The assumptions the agency prints on its own output: the SOBEK model, terrain from 2010–2012, land use from 2008, all flood defence and drainage functioning normally, and buildings not obstructing flow. All of that goes on the data page, because "buildings not obstructing flow" alone invalidates reading a single cell as "my house".
- "Potential" and "will flood" are different things. The same spot has no colour at 200 mm and red at 650 mm; both are correct, and the difference is the assumption. That is why a click lists all ten scenarios, showing how it moves, instead of handing over one colour.
What was left out
- Address-to-coordinate lookup. There is no nationwide service that is both free and legal to use, so it falls back to the 35,339 street and place names indexed for the accident map plus the centroids of 368 townships.
- Historical flooding. The agency's "typhoon flood extent" KML has only 1,231 polygons, concentrated on a few typhoons in 2015–2016 — too incomplete to publish without misleading people.
- Real-time water levels and flood sensors. Different data at a different update rate; another day.
The tool is at lazetool.com/flood and the per-township figures are under township statistics (both in Chinese).